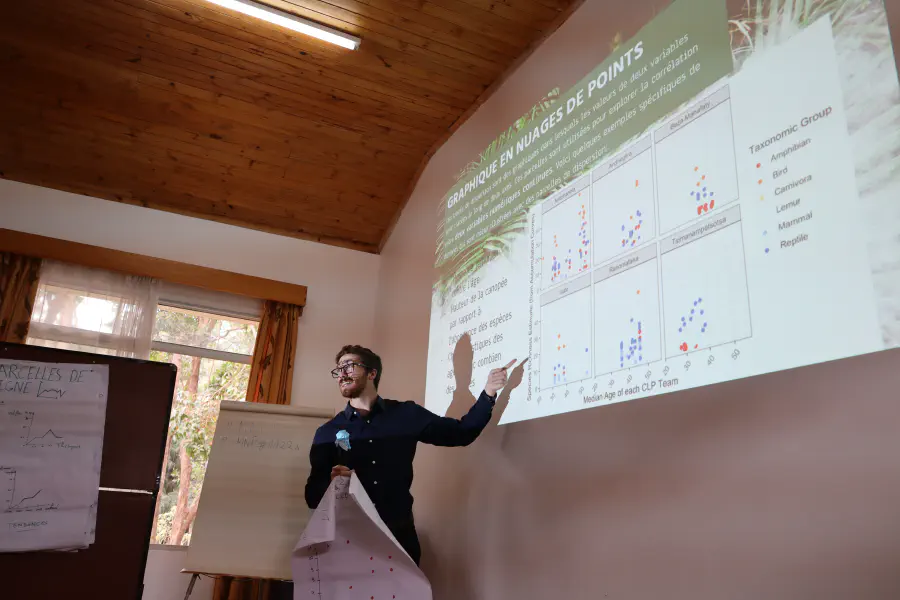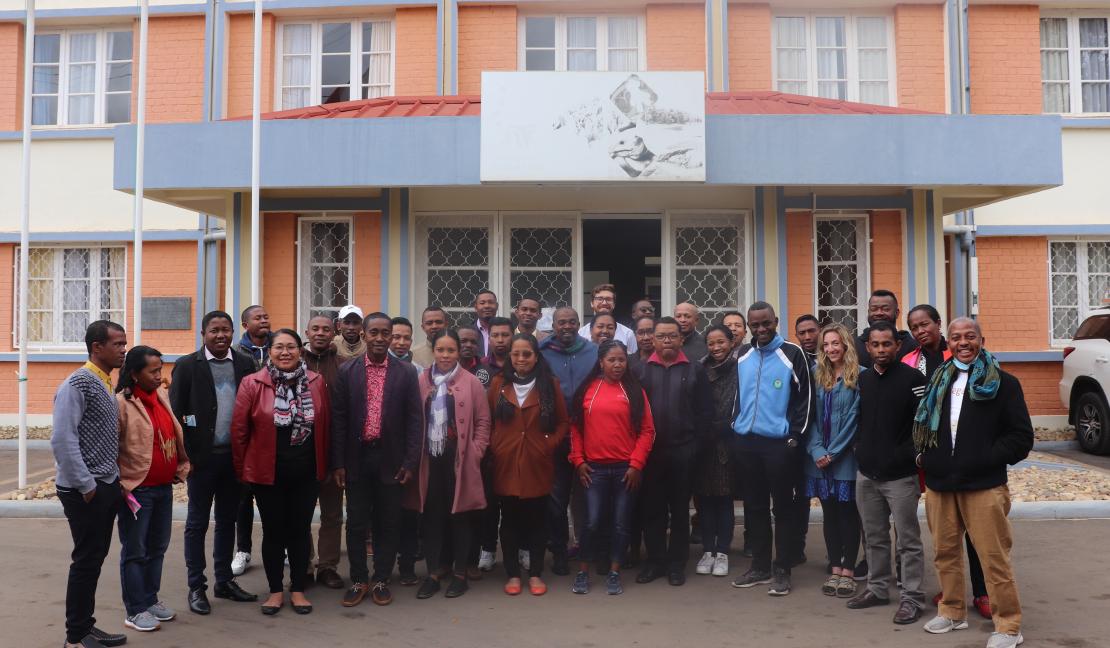
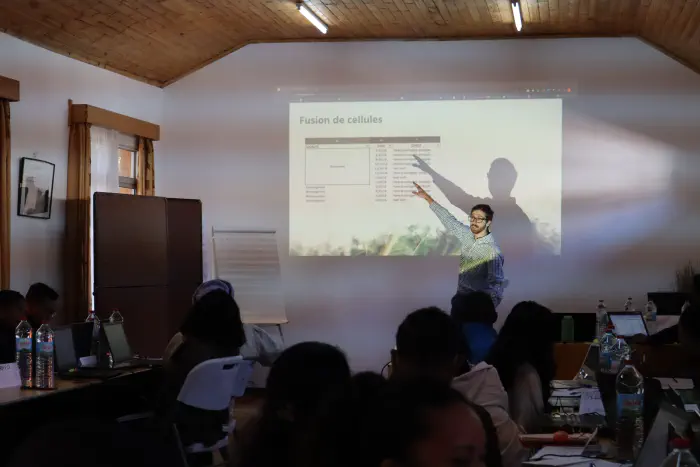
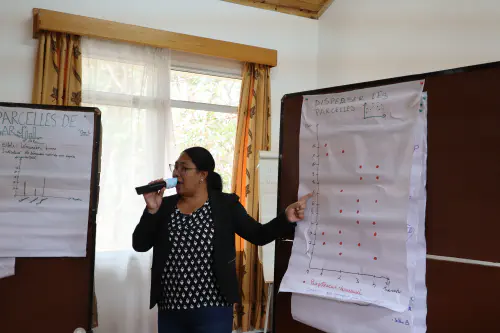
In August 2022, I co-organized a week-long workshop for Madagascar National Parks to develop data management, analysis, and visualization skills, pertaining to the database of vertebrate observations for the 43 terrestrial protected areas across Madagascar. In total there were 37 participants, collectively representing all 43 terrestrial protected areas in Madagascar (some park directorial staff oversee multiple protected areas). The workshop was held in the Ambatobe office headquarters in Antananarivo, Madagascar. The majority of analytical lessons in this workshop were taught in Excel, which was a moderately familiar platform to most workshop attendees, but not fully incorporated or leveraged in data management procedures. Furthermore, prior to the main workshop activities (over five days), we also led two days of focused training on data curation and visualization in R for a smaller group of six participants, and also led an overview and introduction to R for the main workshop group.
During the workshop, we covered several core concepts of proper data management and analysis:
- Best practices for data entry
- Quality assurance, data cleaning and validation
- Data Summarization
- Data Visualization
- Interpretation of Visual and Quantitative results
Furthermore we discussed several components of park management:
- Protocol development
- Updating long-term, species-specific conservation goals for protected areas based upon trends in species richness and population sizes derived from survey data
Finally, we also briefly provided results on recent analyses of our project incorporating local community members into park wildlife monitoring.
The workshop was organized by David Klinges (University of Florida), Dr. Lalatiana Randriamiharisoa (Madagascar National Parks), and Fiona Price (Dartmouth College undergraduate mentored by David Klinges), along with assistance from Andriananarivo Rakotovao (Madagascar National Parks). The R tutorial was co-designed by David Klinges and Fiona Price, and led by Fiona Price; Excel lectures, tutorials, and discussions were led by David Klinges; and protocol development was led by Dr. Lalatiana Randriamiharisoa.
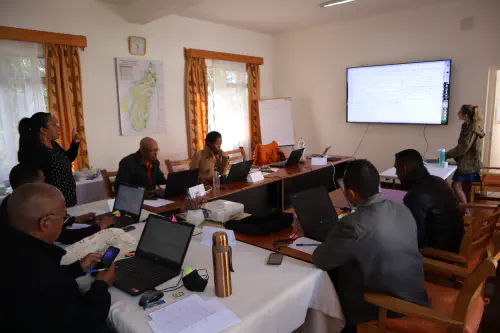
During R tutorials, instructors provided R scripts and necessary software to participants in advance of workshop proceedings, and then conducted live coding with participants following along on their own computers. Such tutorials including challenges and exercises to encourage learning, as well as open-ended activities to allow participants to decide which skills and products they were most interested in focusing upon. During Excel tutorials, lectures were provide to highlight the importance of particular principles and practices of data management. Then, live Excel tutorials were provided with participants following along on their own computers. After the completion of Excel tutorials, participants were called upon to come up in front of the group and re-teach a method or principle of their choice to the group, cementing knowledge by the learning-by-teaching method, and allowing participants to build up leadership skills and pride in their abilities.
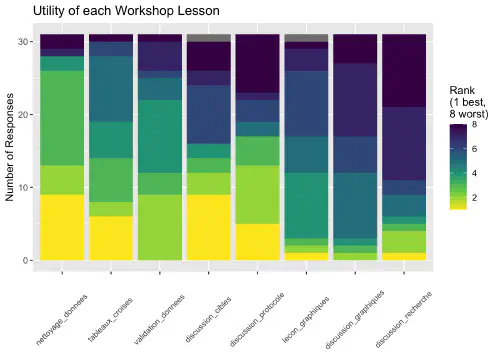
Figure 1. Rankings of the 8 activities conducted during the workshop. Activities covering quantitative skills (cleaning data, summarizing data, validating data) were considered on average the most useful.
During protocol development we discussed how surveys of vertebrate biodiversity can be improved in order to collect data in a manner that more closely matched long-term management goals, as well as leveraged best practices in ecological observation (such as collecting data that would help estimate the probably of detection on a species-specific basis).
Workshop participants were briefly surveyed via questionnaires before and after the workshop. Prior to the workshop, attendees rated themselves as having on average a 3.07/5 for their experience with Excel, and after the workshop rated themselves a 3.68/5. Interest in and importance gauged of R (which was not surveyed prior to the workshop) was on average 4.77/5 and 4.55/5 after the workshop, respectively. On average, participants found the analytical components of the workshop most useful, specifically cleaning data, use of Excel Pivot Tables, and Data Validation (Figure 1). Surprisingly, learning about and discussing data visualization, along with discussing research protocols, were some of the least useful activities (although written entry responses suggested that all activities were helpful and appreciated). Data management tutorials and small-group discussions were the formats of sessions that were found most preferable (Figure 2).
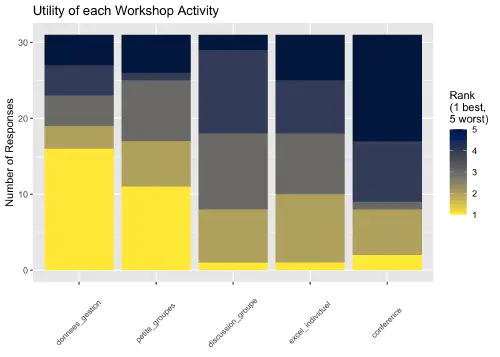
Figure 2. Utility of each method of conducting activities. Lectures for quantitative skills were considered most useful, followed by discussions and brainstorming in small groups.
The workshop organizing committee (David Klinges, Dr. Lalatiana Randriamiharisoa, Fiona Price) has begun discussions to continue workshops of this nature, optimally on a near-annual basis and building upon skills already developed with the same attendees. This workshop laid groundwork of analytical capacity building for Madagascar National Parks, which may have specific and tangible benefits to targeted park management and wildlife conservation.